Project: Corporate Legal Dashboard Analytics
Client: Pharmaceutical Company
A Fortune 500 pharmaceutical company with a large, complex legal organization utilized enterprise matter management technology to manage its multi-million dollar legal operation.
Challenge: Limited Reporting and Analysis Limits Effective Management of Legal Departments
While the tool allowed the organization to effectively manage legal information, processes and outside counsel, it delivered only limited reporting capabilities and intelligence. Reports needed to be written by IT and required significant turnaround time. As a result, timely reporting, analysis, and informed decision making was limited. The legal organization needed a solution that could leverage their matter management data with user-driven reporting capabilities to deliver better, and more accessible, visibility into their business.
Solution: Legal Dashboard Implementation Delivers Visibility
Dunn Solutions Group recommended their Legal Dashboard product, an out-of-the-box web-based reporting solution for legal organizations within Fortune 500 companies. The solution leverages powerful business intelligence software to integrate and consolidate data from matter management systems and delivers key performance indicators (KPIs) using dynamic visualizations.
The team first determined the required universal KPI's and customized the forty standard reports for use across the legal organization. These included reports to identify outside counsel spend, top matters by spend, department budget tracking, and outcome/result summaries. Customized, department-specific KPI's were also needed to enable each of the organization's nine legal areas to better manage their activity; for example a Patents Issued/Granted KPI for the Patents department. After a Gap Analysis determined that there was supporting data for the customized KPI's, the product's data mart was updated and each department was given secured access to their information.
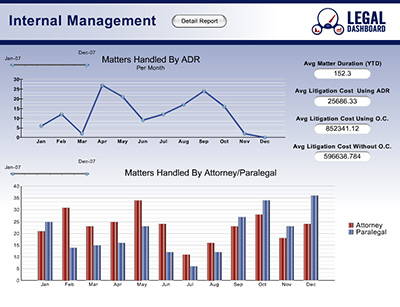
Easy-to-understand speedometers, graphs, tables and alerts were introduced for valuable insight into the standard and customized metrics. The data mart enabled ad hoc reporting capabilities above and beyond the standard reports and KPI's so that approved end users can access a widget gallery to design individualized dashboards specific to their needs.
Result
The Legal Dashboard was successful in helping the legal organization derive more value from their matter management technology with user-friendly, sophisticated reporting that can be accessed at any time. Management has a whole new perspective of their business and is able to make more informed decisions as a result. Matter intelligence such as case assignment and case outcomes allow the company to identify the most effective outside counsel, resulting in improved outcomes and cost savings.