Francesco Sguanci
1 Year Ago
Whether you are tracking the effectiveness of a marketing campaign, the “accuracy” of your predictive model, or the time savings from your newly re-engineered process, you should always have clearly defined Key Performance Indicators (KPIs) and well-thought-out processes for measuring success.
Common Misconceptions About A/B Testing
In marketing analytics, A/B testing is a beloved technique used by data-driven marketing teams to validate their findings, and over the years I have come to believe that many analysts see it as a silver bullet, an answer to all performance questions.
What I have observed over and over is that there are a few common misconceptions about A/B and what questions it can and cannot help to answer. Misuse of A/B testing often results in poor business decisions and weakened trust in analytics.
Two Common and Least Understood Mistakes
I can think of at least ten common mistakes that companies make when performing A/B testing, but while any and each of these will invalidate your test, I would like to focus on the two that are most common and least understood: testing the wrong hypothesis, and focusing on the wrong KPIs.
An Example of Testing the Wrong Hypothesis
Let me give you an example: a little while ago we developed a churn model for a major online retailer (check out my churn blog for more information about churn modeling) to assign a risk score to every existing customer. Our client believed that knowing who was most likely to churn would help them tremendously with their retention efforts. However, they first had to validate the model results: how do we know “for sure” that the model is in fact correctly predicting who is at risk?
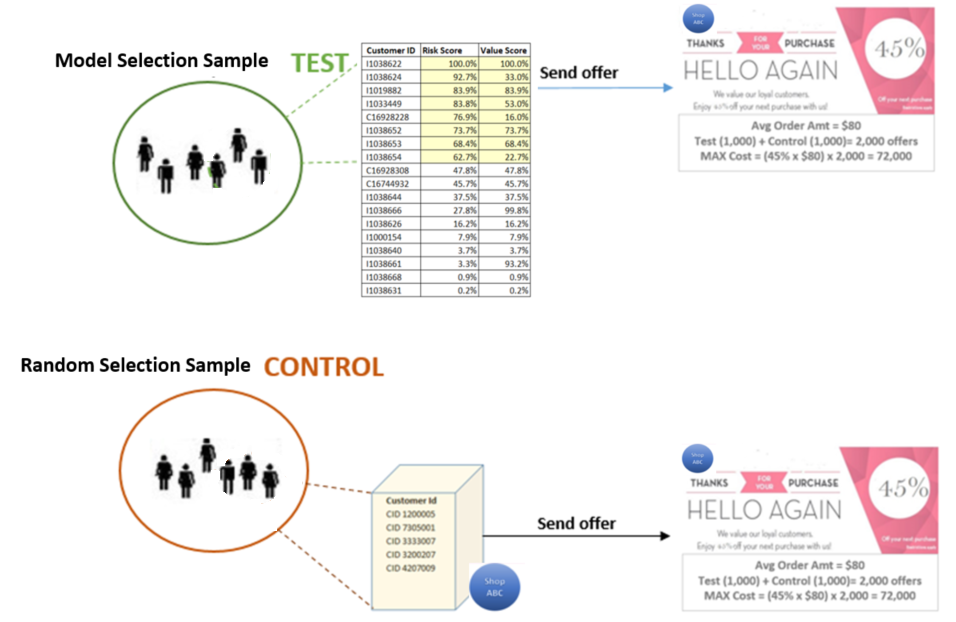
The client wanted to run an A/B test to validate the results. They set up the A/B testing internally as follows:
- They randomly split all customers into two groups. They selected 5,000 customers from each of the two random groups using two different criteria:
- The first 5,000 were selected based on the risk score of our model (from highest to lowest) – this group was named the TEST group.
- The other 5,000 were selected using their current strategy of determining if a customer was churning (60+ days from last purchase) – This group was named the CONTROL group.
- Next, they sent the exact same offer (45% off on next purchase) to all customers in both groups.
- The hypothesis to be tested was: “if the model way of identifying churners is better than our current methodology, then the test group will have a higher response rate than the control group”
Problem with Test Design
What do you think the results were? The response rate for the CONTROL group was higher than for the TEST group and the client wondered why the model was underperforming their current strategy. Do you see a problem with the way the test was conducted?
Let’s see. First of all, let’s keep in mind WHO and WHAT we are measuring. The people in the TEST group are customers who, without intervention, will not buy again and their risk score takes into account each customer’s unique repurchasing time. On the contrary, people in the CONTROL group are simply people who have not bought in 60 days. While it’s possible that some of them are churners, it’s just as possible that some of them have much longer repurchasing behavior and that they would have bought at a later time.
For example, assume three people responded to the offer in the test group, then because these people were real churners and the model correctly identified them, we had three incremental sales, sales we would not have had. At the same time, say that five people responded to the offer in the control group, but three of them were just a little “late” and would have bought anyway; then, your real incremental sales were only two, while you gave 45% off to three customers who would have paid full price!!
Importance of Valid KPIs
Now you can see that “number of responses” was NOT a valid KPI to measure the validity and usefulness of a statistical model and that the A/B test, the way it was designed, was useless.
A meaningful A/B test would have controlled for people who would have bought anyway at a later time. And that’s exactly what we did for the client: we re-designed the experiment and tested the methodologies again and this time the results were unquestionable: 88% of customers in the TEST group were truly incremental, compared to only 53% of the control group!
I just described the two most common mistakes; what about the other eight?
Conclusion
Would your organization be able to set up an experiment avoiding all of them? Would it be cost-efficient? Why not leverage Dunn Solutions’ proven expertise in the design and measuring of experiments?
Dunn Solutions’ predictive analytics team would be glad to give you a no-charge evaluation of your data and discuss whether there’s an opportunity to design the correct approach to reach your business goals! Contact us today at info@dunnsolutions.com