
Brandon Novy
1 Year Ago
As an instructor, I’m often asked if I’ve heard of different brands of software. One of the most commonly mentioned programs is a dashboarding tool called QlikView. I noticed that there is a free, personal edition on their web site, so I thought I’d give it a shot. Once I passed the hurdle of bringing in my data set, I was amazed at how quickly things “just worked.” I spent most of the time massaging my dataset, so I thought I’d share the hardest steps so you can jump into the fun part of the tool.
Scenario:
Let’s say your company has acquired a new company. Your manager wants a dashboard showing the products and recent history of the new organization. (I forgot to mention that it’s needed tomorrow morning). Your manager wants something easy to digest as she will be using that information for a meeting. The data from the new company is so new that it is not available in your enterprise business intelligence suite. You know that the data is stored in a Microsoft SQL Server database to which you have access. How can you present the data in an interactive form?
Solution:
Download a copy of QlikView and extract the data from your database. This blog will be using AdventureWorks2008R2. The blog also assumes that you will have AdventureWorks2008R2 installed. We will also be using an ODBC connection to the database called AdventureWorks2008.
Steps:
Gathering Data:
In these first steps, we will collect multiple tables of data from SQL Server. Qlikview joins tables automatically based on ID. For example, the Product and ProductInventory tables will be combined via the ProductID. (As this is an automated process, it’s recommended to rename non-indexed columns that share the same name to prevent QlikView from trying to join them).
- Launch QlikView 11
- Select File --> New
- Select Cancel
- Select File --> Edit Script
- Select Connect
- Select AdventureWorks2008 and OK
- Copy/paste over the following SQL statements beneath the ODBC line. If your ODBC is NOT named AdventureWorks2008, you must change the FROM statement in every line to match the name of your ODBC connection.
//-------- Start Multiple Select Statements ------
SQL SELECT ProductID, ProductSubCategoryID, Name as ProductName, ProductNumber, Color, StandardCost, ListPrice, Size
FROM AdventureWorks2008.Production.Product;

SQL SELECT ProductID, Quantity
FROM AdventureWorks2008.Production.ProductInventory;

SQL SELECT ProductSubCategoryID, ProductCategoryID, Name as ProductSubCategoryName
FROM AdventureWorks2008.Production.ProductSubcategory;

SQL SELECT ProductCategoryID, Name as ProductCategoryName
FROM AdventureWorks2008.Production.ProductCategory;

SQL SELECT SalesOrderID, OrderQty, ProductID, UnitPrice, UnitPriceDiscount, LineTotal
FROM [AdventureWorks2008].[Sales].[SalesOrderDetail];

SQL SELECT SalesOrderID, OrderDate, year(OrderDate) as OrderYear
FROM [AdventureWorks2008].[Sales].[SalesOrderHeader]

//-------- End Multiple Select Statements ------
- Click the Save button
- Save the file as Product.qvw
- Click the Reload button
- In the box on the right, add Color, ProductCategoryName
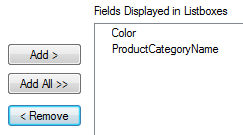
- Click OK
- Move the boxes the left-side of the dashboard. Resize them as needed.
Building a Bar Chart:
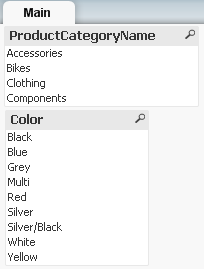
In the previous set of steps, we pulled data from our databases and created two list boxes to act as selectors. Next, we will add a bar chart with SubCategory and Quantity information. Once the chart is built, we can automatically filter its contents by manipulating the list boxes.
- Click the Quick Chart Wizard button
- Click Next
- Bar Chart
- First Dimension: ProductSubCategoryName. Click Next.
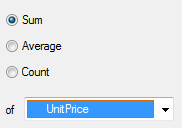
- Sum of Quantity. Click Next.

- Click Finish
Building a Line Chart:
Next, let’s build a line chart with OrderYear and UnitPrice information. The OrderYear information was rolled from OrderDate data retrieval process:
SQL SELECT SalesOrderID, OrderDate, year(OrderDate) as OrderYear
- Click the Quick Chart Wizard button
- Click Next
- Line Chart
- First Dimension: OrderYear. Click Next.
- Sum of UnitPrice. Click Next.
- Click Finish
Testing:
- Play around with the boxes on the left. See what happens to the bar chart and line chart.
- Below is an example of how your QlikView screen could look.
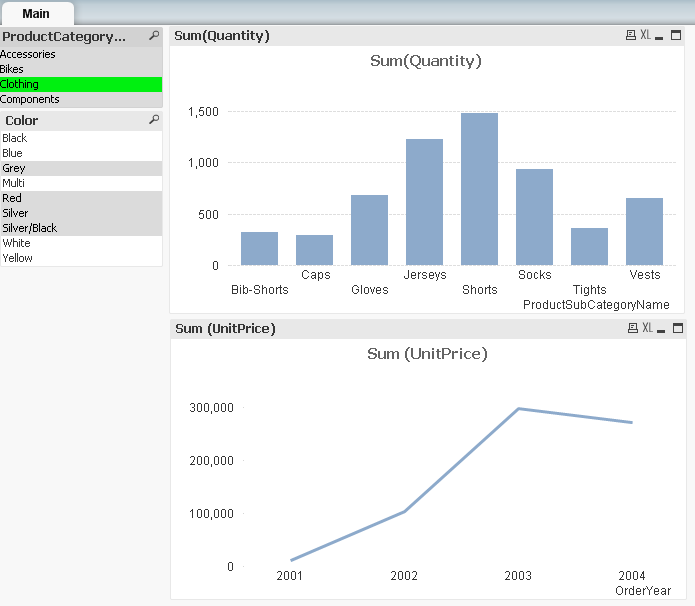
That’s all it takes to get started! Remember to go back to the Script Editor (Ctrl-E) if there is something too complex to be handled directly in a chart. (OrderYear was calculated in the script and not compiled in the chart itself).
Let me know what you think.